Synonyms
More meanings
Tip: select a single word for meaning & synonyms.
Select multiple words normally to copy text.

Here, you will find summaries, questions, answers, textbook solutions, pdf, extras etc. of (Nagaland Board) NBSE Class 11 Education Chapter 12: Introduction to Statistics in Education. These solutions, however, should be only treated as references and can be modified/changed.
Statistics, the science of collecting, analyzing, and interpreting data, plays a pivotal role in various fields, including education. It provides a quantitative foundation for educational research and policy, enabling us to make informed decisions based on empirical evidence.
One of the significant uses of statistics in education is predicting future academic performance. By analyzing past and present data, educators and policymakers can forecast trends, helping them make strategic decisions about resource allocation and curriculum development. Moreover, statistics can establish relationships between different variables, such as the correlation between students’ attendance and their academic performance.
Statistics also assist governments in policy formulation. For instance, when planning to implement free education, statistical data can provide answers to critical questions like the number of schools required or the number of teachers to be appointed. This data-driven approach ensures that policies are practical, feasible, and tailored to the population’s needs.
Furthermore, statistics simplify complex data, making it easier to understand. Complex data, when expressed in graphs, diagrams, averages, or percentages, becomes more digestible, facilitating better comprehension among students and educators alike. This simplification is particularly beneficial in subjects like commerce and economics, where data interpretation is crucial.
Visual representation of data, such as histograms and frequency polygons, further enhances our understanding of statistics. A histogram, which represents class frequencies by vertical rectangles, provides a visual interpretation of data distribution. On the other hand, a frequency polygon, a line graph plotted against class mark, offers a different perspective on data distribution. Both these tools, while different in their representation, provide valuable insights into the data, making statistics a powerful tool in education.
1. What is statistics?
Answer: Statistics is the science which deals with methods of collection, presentation, analysis and interpretation of quantitative measurement.
2. What is data?
Answer: Data means a collection of any number of related observations.
3. Explain statistics in (i) singular sense (ii) plural sense.
Answer: (i) Statistics in singular sense means the science dealing with tabulation, classification, analysis and interpretation of numerical facts.
(ii) Statistics in plural sense means numerical facts systematically collected. It indicates information in terms of numbers or numerical data such as employment statistics or population statistics.
4. What is a Bar Chart?
Answer: A bar chart is a graph that consists of a number of rectangles of equal width (base) but length or height of the rectangle is proportional to the value they represent.
5. What is a Histogram?
Answer: Histogram is defined as a graph that represents the class frequencies in a frequency distribution by vertical rectangles.
6. What is frequency polygon?
Answer: Frequency polygon is a line graph of class frequency plotted against class mark.
1. Mention four functions of statistics.
Answer: Four functions of statistics are as under:
2. Discuss the important methods of collecting data.
Answer: The important methods of collecting data are:
3. Differentiate between primary source and secondary source of data.
Answer: Primary source of data is referred to the data collected and issued by the same source or agency. Secondary source of data is referred to as the data published or used by one source or agency or organisation, but originally collected and compiled by some other source or agency.
4. Explain Tabulation.
Answer: Tabulation is a systematic presentation of numerical data in rows and columns related with some important characteristics and features. Data is tabulated to simplify the complex data for comparison.
1. Discuss the uses of statistics.
Answer: The uses of statistics are as follows:
2. Discuss the important functions of statistics.
Answer: The functions of statistics are as under :
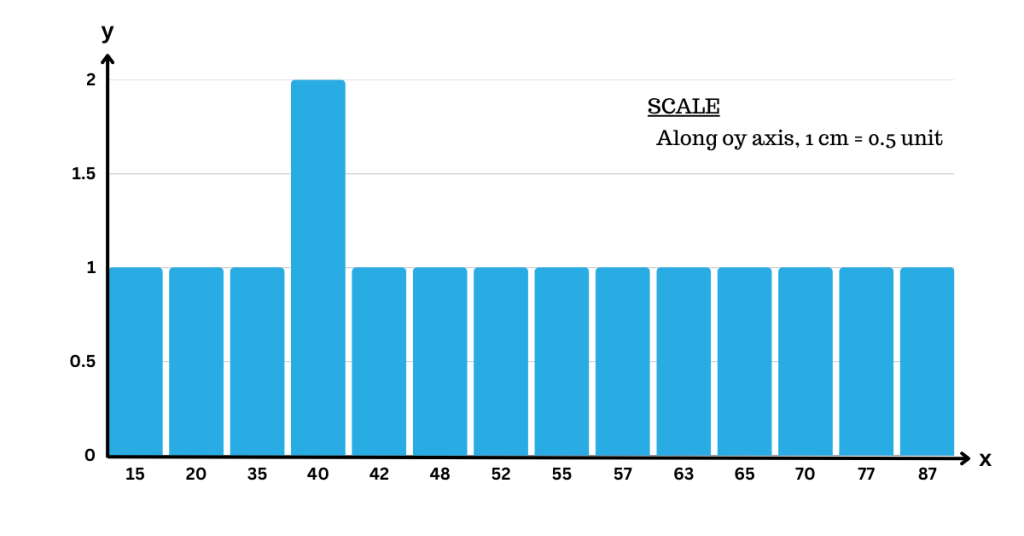
3. Make a frequency table and Bar Chart of the marks obtained out of 100 by 15 students of class XI in English as given below.
87, 57, 20, 15, 35, 77, 63, 42, 55, 48, 52, 65, 70, 40, 40
Answer:
| Marks | Frequency |
| 15 | 1 |
| 20 | 1 |
| 35 | 1 |
| 40 | 2 |
| 42 | 1 |
| 48 | 1 |
| 52 | 1 |
| 55 | 1 |
| 57 | 1 |
| 63 | 1 |
| 65 | 1 |
| 70 | 1 |
| 77 | 1 |
| 87 | 1 |
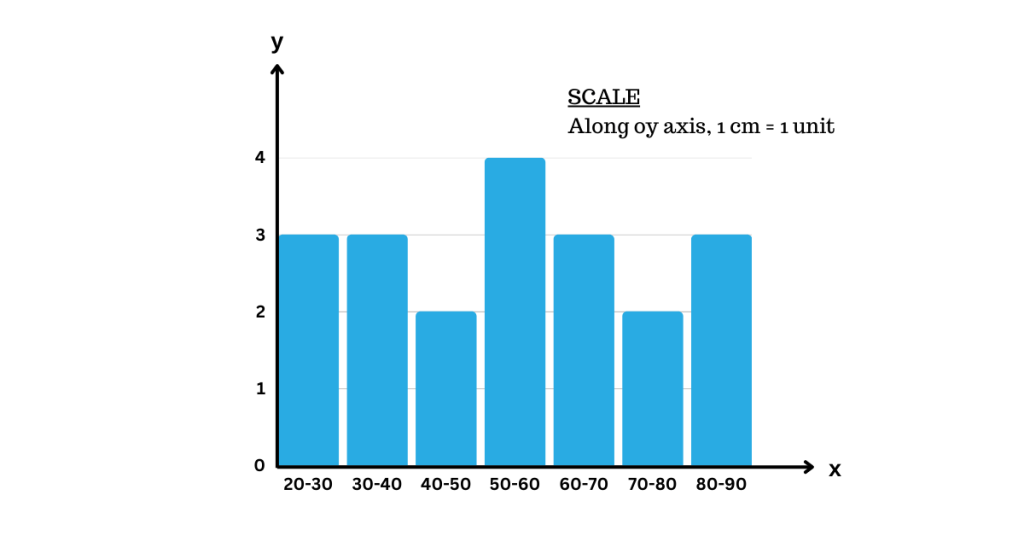
4. Prepare a frequency distribution table and histogram from the given data. Marks obtained by 20 students of Class XI are as under:
85 75 65 25 45
57 67 77 27 37
72 22 42 82 62
66 76 56 36 55
Answer:
| Marks Range | Frequency |
| 20-30 | 3 |
| 30-40 | 3 |
| 40-50 | 2 |
| 50-60 | 4 |
| 60-70 | 3 |
| 70-80 | 2 |
| 80-90 | 3 |
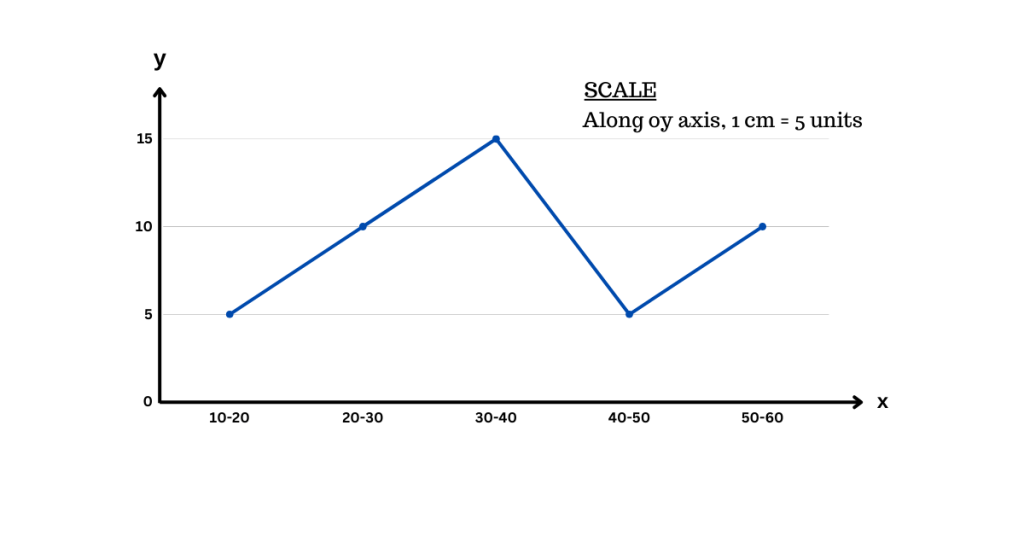
5. Prepare a frequency polygon of the following data.
| Marks | 10-20 | 20-30 | 30-40 | 40-50 | 50-60 |
| No. of students | 5 | 10 | 15 | 5 | 10 |
Answer:
1. Discuss the importance of statistics in the field of education.
Answer: Statistics helps us to predict the future academic performance of educational institutions on the basis of present and past data. It helps us to find a relation between two or more variables. It helps the government to collect information from various quarters in order to formulate any policy. For instance, if the government wants to make education free, statistics can answer questions such as how many schools are required and how many teachers need to be appointed. Statistical data is essential in every walk of life and no field of study is complete without statistics. Students can better understand the subjects like commerce, economics, education etc., with the help of statistics. Statistics simplifies complex data. When a complex data is expressed in graphs, diagrams, curves, averages, percentage etc., it becomes easy to understand. Statistics also helps in economic planning.
2. How Frequency Polygon is different from histogram? Explain.
Answer: A Frequency Polygon is a line graph of class frequency plotted against class mark. It can be obtained by two methods: by using a Histogram or without using a Histogram. When using a Histogram, the mid-points of the upper horizontal sides of each rectangle are joined by dotted lines. The mid-points of two class intervals of zero frequency, one adjacent to the first on its left and another adjacent to the last, on its right, are obtained. The polygon is completed by joining the mid-points of first and last class intervals to the mid-point of the imagined class intervals adjacent to them.
On the other hand, a Histogram is a graph that represents the class frequencies in a frequency distribution by vertical rectangles. The basic rules for constructing histograms are similar to those for bar graphs, except that the data to be illustrated as the histograms is in the form of a frequency distribution table, where we have class intervals instead of discrete variables and frequency in place of the value of the variable. Here, class intervals form the base of the bars or rectangles and the frequency of the class intervals will form the height of the rectangle. For equal class intervals, the width of the rectangles will be equal. As the class intervals are continuous, the rectangles will be adjacent to each other without a gap between them.
1. What is the origin of the word ‘statistics’?
Answer: The word ‘statistics’ is derived from the Latin term ‘statisticum collegium’ which means a lecture on the state of affairs. This term was used for the first time by German mathematician Gottfried Achenwall in 1749.
2. What is the meaning of the term ‘Statistics’ according to the old records?
Answer: In old times, the term ‘Statistics’ referred to numerical descriptions of quantitative aspects of things, such as count and measurement. Numerical records were maintained regarding divisions of state, their population, birth rate, and income, which is part of statistics.
3. What are the key tasks involved in the science of statistics?
Answer: Statistics involves several key tasks including the collection of data, which is the process of procuring measurements or counts; organisation of data, which is presenting the collected measurements or counts in a suitable form; analysis of data, which involves computation of means and degrees of variation; and interpretation of data, which is discovering the cause-effect relationship between various types of data and the inferences.
4. What are the definitions of ‘Statistics’ according to Horace Secrist and Bowley?
Answer: According to Horace Secrist, “Statistics is an aggregate of facts affected to a marked extent by multiplicity of causes, numerically expressed, enumerated or estimated according to a reasonable standard of accuracy, collected in systematic manner for a predetermined purpose and placed in relation to each other”. On the other hand, Bowley defines statistics as “numerical statement of facts in any department of enquiry placed in relation to each other”.
5. What is the general understanding of ‘Statistics’ for an ordinary person?
Answer: For an ordinary person, ‘Statistics’ means data. This data refers to a collection of any number of related observations, such as the percentage of students who scored the first division in higher secondary arts stream under Nagaland Board of School Education in 2014.
Q. What are the two forms of Statistics?
Answer: Statistics is of two forms: Singular sense and Plural Sense. In the singular sense, Statistics is defined as a science related to the collection, presentation, analysis, and interpretation of numerical data. In the plural sense, Statistics is defined as the systematic collection of numerical facts indicating information in terms of numbers or numerical data such as employment statistics or population statistics.
Q. Could you provide a detailed explanation of the definitions of Statistics as provided by Horace Secrist and Bowley?
Answer: Horace Secrist defines “Statistics” as an aggregate of facts that are affected significantly by a multiplicity of causes. These facts are numerically expressed, enumerated or estimated according to a reasonable standard of accuracy. They are collected systematically for a predetermined purpose and are related to each other. This definition points towards the systematic nature of statistics, the requirement for accuracy, and the need for a specific purpose for data collection. On the other hand, Bowley defines “statistics” as a numerical statement of facts in any department of inquiry placed in relation to each other. This definition emphasizes that the numerical facts should pertain to a department of inquiry and must be related to each other to be called statistics. It underlines the aspect of relation between data points and its relevance to a specific area of study.
Q. What are some of the key reasons that make statistics important?
Answer: Statistics are critically important in our daily lives for numerous reasons:
Q. What are the key functions of statistics?
Answer: The functions of statistics include:
Q. What is data and what are the primary sources of data collection?
Answer: Data refers to a collection of related information in the form of numbers. Data can be collected from two primary sources:
Q. What are the four methods of collecting data?
Answer: The four methods of collecting data are: Direct Personal Interview, Indirect Personal Interview, Information from Correspondents, and Mailed Questionnaires.
Q. Can you explain the method of data collection called “Direct Personal Interview”?
Answer: Direct Personal Interview is a method of data collection where the investigator personally interviews someone who is in a position to supply the required information. This method involves direct interaction between the investigator and the individual providing the data.
Q. What is meant by “Indirect Personal Interview” in data collection?
Answer: The method of Indirect Personal Interview in data collection involves interviewing individuals who possess knowledge of the relevant matter or event in order to gather the required data. Instead of directly engaging with the primary source, the investigator collects data from those who have pertinent knowledge.
Q. How does the method of “Information from Correspondents” work in data collection?
Answer: The “Information from Correspondents” method in data collection works by appointing local agents in different areas and phases of investigation to collect data. These agents then gather data, and the information they collect is subsequently used in the study.
Q. Describe the “Mailed questionnaires” method of data collection.
Answer: The “Mailed questionnaires” method of data collection involves sending questionnaires by post to individuals to gather information. These questionnaires, which are lists of questions related to the research topic, are sent out with a request to the recipients to answer and return them within a specified time frame.
Q. What is tabulation and why is it important?
Answer: Tabulation is the systematic presentation of numerical data in rows and columns related to some important characteristics and features. The data is tabulated to simplify complex data for comparison. Tabulation is essential as it makes the data easier to understand and compare, and it facilitates the graphical representation of the data on graphs and diagrams.
Q. What are the important features of a table?
Answer: The important features of a table are: Table Number, Title, Captions and Subs, Body of Table, Head Notes, Foot Notes, and Source.
Q. What are the two types of tables?
Answer: The two types of tables are: Reference or General Tables and Summary Tables.
Q. Explain the term “Reference or General Table.”
Answer: Reference or General Tables are storehouses of information, presenting detailed statistical material. They are constructed with the aim of offering comprehensive data pertinent to the investigation or study.
Q. What do you understand by “Summary Table”?
Answer: Summary Tables are comparatively smaller in size and are used to examine items, make comparisons or evaluate relations. They succinctly present the data, making it easier for researchers to derive meaningful insights from the information.
Q. What is a graphic representation? Name some commonly used diagrams.
Answer: Graphic representation refers to the methods of presenting classified data in the form of graphs or diagrams. It is essentially a visual representation and reproduction of tabulated data. Commonly used diagrams include Pictographs, Bar Charts, Histograms, Frequency Polygon, Line graph, and Pie diagrams.
Q. Describe a Bar Chart.
Answer: A Bar Chart is a graph that consists of a number of rectangles of equal width (base), but the length or height of the rectangle is proportional to the value they represent. The numerical values are very easily compared by examining the lengths of the bars. It is an effective way to visually compare numerical data.
Q. What is a histogram?
Answer: A histogram is a graph that represents the class frequencies in a frequency distribution by vertical rectangles.
Q. How does a histogram differ from a bar graph?
Answer: The main difference between histograms and bar graphs lies in the type of data they illustrate. Histograms are used when the data is in the form of a frequency distribution table, where we have class intervals instead of discrete variables, and frequency in place of the value of the variable. In contrast, bar graphs typically illustrate discrete variables.
Q. Explain the process of constructing a histogram from given data.
Answer: For constructing histograms, we utilize data in the form of a frequency distribution table. The class intervals form the base of the bars or rectangles while the frequency of these class intervals will form the height of the rectangle. For equal class intervals, the width of the rectangles will be equal. Essentially, each rectangle’s height is proportionate to the frequency of the data in that interval.
Q. What is a Frequency Polygon and how is it related to a histogram?
Answer: A Frequency Polygon is a line graph of class frequency plotted against class mark. There are two methods to construct a frequency polygon: using a histogram and without using a histogram. When using a histogram, the mid-points of the upper horizontal sides of each rectangle are obtained. These mid-points of the adjacent rectangles are joined by dotted lines. The mid-points of two class intervals of zero frequency, one adjacent to the first on its left and another adjacent to the last, on its right, are obtained. The polygon is completed by joining the mid-points of first and last class intervals to the mid-point of the imagined class intervals adjacent to them.
27. Explain the process of constructing a frequency polygon without using a histogram.
Answer: To construct a frequency polygon without a histogram, the following steps are followed:
This creates a polygonal line, thus forming the frequency polygon. The polygon provides a visual representation of the data, making it easier to understand the overall distribution.
1. From which language is the term ‘statistics’ derived?
A. German B. Latin C. French D. Greek
Answer: B. Latin
2. Who first used the word ‘Statistics’?
A. Horace Secrist B. Bowley C. Gottfried Achenwall D. Aristotle
Answer: C. Gottfried Achenwall
3. In what year was the word ‘Statistics’ first used by Gottfried Achenwall?
A. 1849 B. 1749 C. 1649 D. 1949
Answer: B. 1749
4. What does the process of ‘collection of data’ involve?
A. Procurement of measurements or counts B. Numerical statement of facts C. Aggregation of facts D. Organisation of numerical facts
Answer: A. Procurement of measurements or counts
5. What does the ‘organisation of data’ refer to?
A. Presentation of measurements in a suitable form B. Numerical description of quantitative aspects C. Collection of data in a systematic manner D. Interpretation of data
Answer: A. Presentation of measurements in a suitable form
Q. What does ‘analysis of data’ mean in the context of Statistics?
A. Calculation of means and degrees of variation B. Presentation of data in tables, diagrams or graphs C. Procurement of measurements or counts D. Discovery of the cause-effect relationship
Answer: A. Calculation of means and degrees of variation
Q. What does ‘interpretation of data’ involve?
A. Discovery of the cause-effect relationship between data types B. Numerical description of quantitative aspects C. Organisation of numerical facts D. Collection of data in a systematic manner
Answer: A. Discovery of the cause-effect relationship between data types
Q. How does Horace Secrist define ‘Statistics’?
A. Numerical statement of facts in relation B. Aggregate of facts affected to a marked extent by multiplicity of causes C. Numerical description of quantitative aspects D. Collection of numerical facts
Answer: B. Aggregate of facts affected to a marked extent by multiplicity of causes
Q. What does Bowley’s definition of ‘Statistics’ focus on?
A. Numerical description of quantitative aspects B. Aggregate of facts C. Numerical statement of facts in any department of enquiry D. Systematic collection of numerical facts
Answer: C. Numerical statement of facts in any department of enquiry
Q. In singular sense, how is ‘Statistics’ defined?
A. Systematic collection of numerical facts B. Numerical statement of facts in any department of enquiry C. Aggregate of facts affected by multiplicity of causes D. Science related with collection, presentation, analysis, and interpretation of numerical data
Answer: D. Science related with collection, presentation, analysis, and interpretation of numerical data
Q. What subject areas can be better understood with the help of statistics?
A. Physics, Chemistry, Biology B. Commerce, Economics, Education C. Art, Music, Drama D. Engineering, Computer Science, Medicine
Answer: B. Commerce, Economics, Education
Q. How does statistics help in understanding complex data?
A. By increasing complexity B. By ignoring the data C. By simplifying the data D. By modifying the data
Answer: C. By simplifying the data
Q. Which organization is a primary source of data?
A. World Bank B. International Monetary Fund C. Reserve Bank of India D. United Nations
Answer: C. Reserve Bank of India
Q. What does the I.Q. stand for in the context of statistics functions?
A. Income Quotient B. Integrity Quotient C. Intelligence Quotient D. Integration Quotient
Answer: C. Intelligence Quotient
Q. How does statistics help in formulating government policies?
A. By collecting data from various quarters B. By ignoring the data C. By modifying the data D. By discarding the data
Answer: A. By collecting data from various quarters
Q. What does E.Q. stand for in the context of statistics functions?
A. Emotional Quotient B. Education Quotient C. Energy Quotient D. Efficiency Quotient
Answer: B. Education Quotient
Q. Which of these is not a function of statistics?
A. Measuring the achievement of students in different subjects B. Identifying the causes of earthquakes C. Classifying various activities D. Summarising results in meaningful and convenient forms
Answer: B. Identifying the causes of earthquakes
Q. Which of these is a potential issue with data collected from secondary sources?
A. Lack of authenticity B. Clerical mistakes C. Too much data D. All of the above
Answer: B. Clerical mistakes
Q. How does statistics aid in economic planning?
A. By predicting the stock market B. By predicting natural disasters C. By simplifying complex data D. By formulating government policies
Answer: D. By formulating government policies
Q. What does statistics help in predicting about educational institutions?
A. The future infrastructure B. The future academic performance C. The future teaching staff D. The future cafeteria menu
Answer: B. The future academic performance
Q. What method of data collection involves interviewing someone who can provide required information?
A. Indirect Personal Interview B. Mailed Questionnaires C. Information from Correspondents D. Direct Personal Interview
Answer: D. Direct Personal Interview
Q. Which method of data collection uses local agents to gather information?
A. Direct Personal Interview B. Indirect Personal Interview C. Information from Correspondents D. Mailed Questionnaires
Answer: C. Information from Correspondents
Q. In data collection, what is sent by post to persons with a request to return within a specified time?
A. Letters B. Invitations C. Mailed Questionnaires D. Gifts
Answer: C. Mailed Questionnaires
Q. What is the systematic presentation of numerical data in rows and columns called?
A. Illustration B. Diagram C. Tabulation D. Graphing
Answer: C. Tabulation
Q. What are the headings and sub-headings given to columns in a table referred to as?
A. Subs B. Captions C. Head Notes D. Foot Notes
Answer: B. Captions
Q. What is a statement that classifies a specific entry or part of a table called?
A. Head Note B. Sub C. Foot Note D. Caption
Answer: C. Foot Note
Q. What type of table is used to examine items, comparisons, or relations?
A. Reference Table B. Summary Table C. Caption Table D. Data Table
Answer: B. Summary Table
Q. In a graphical representation, what type of diagram consists of rectangles of equal width?
A. Line Graph B. Bar Chart C. Frequency Polygon D. Pie Diagram
Answer: B. Bar Chart
Q. Which method of data collection involves interviewing individuals with relevant knowledge, but not directly involved in the event or matter?
A. Direct Personal Interview B. Indirect Personal Interview C. Information from Correspondents D. Mailed Questionnaires
Answer: B. Indirect Personal Interview
Q. What feature of a table indicates from where the data is obtained?
A. Table Number B. Captions and Subs C. Source D. Head Notes
Answer: C. Source
Q. What does a histogram represent?
A. Class intervals B. Discrete variables C. Class frequencies D. Value of variables
Answer: C. Class frequencies
Q. What forms the base of the bars in a histogram?
A. Frequency B. Class intervals C. Mid-points D. Upper limit
Answer: B. Class intervals
Q. In a histogram, what forms the height of the rectangle?
A. Class intervals B. Upper limit C. Frequency D. Lower limit
Answer: C. Frequency
Q. What does the width of rectangles represent in a histogram for equal class intervals?
A. Frequency B. Equality C. Upper limit D. Lower limit
Answer: B. Equality
Q. What is a frequency polygon?
A. A pie chart B. A line graph of class frequency C. A histogram D. A bar graph
Answer: B. A line graph of class frequency
Q. How can a frequency polygon be constructed?
A. By using a pie chart B. By using a bar graph C. By using a histogram D. By using a line graph
Answer: C. By using a histogram
Q. To draw a frequency polygon without a histogram, what must be calculated?
A. Upper limit B. Lower limit C. Class mark D. Frequency
Answer: C. Class mark
Q. In a frequency polygon without a histogram, what marks are plotted along the x-axis?
A. Frequency B. Upper limit C. Lower limit D. Class marks
Answer: D. Class marks
Q. In a frequency polygon without a histogram, what marks are plotted along the y-axis?
A. Frequency B. Class marks C. Lower limit D. Upper limit
Answer: A. Frequency
40. What is the formula for calculating the class mark?
A. Upper limit – Lower limit/2 B. Upper limit + Lower limit*2 C. Upper limit + Lower limit/2 D. Upper limit / Lower limit
Answer: C. Upper limit + Lower limit/2
Only for registered users